
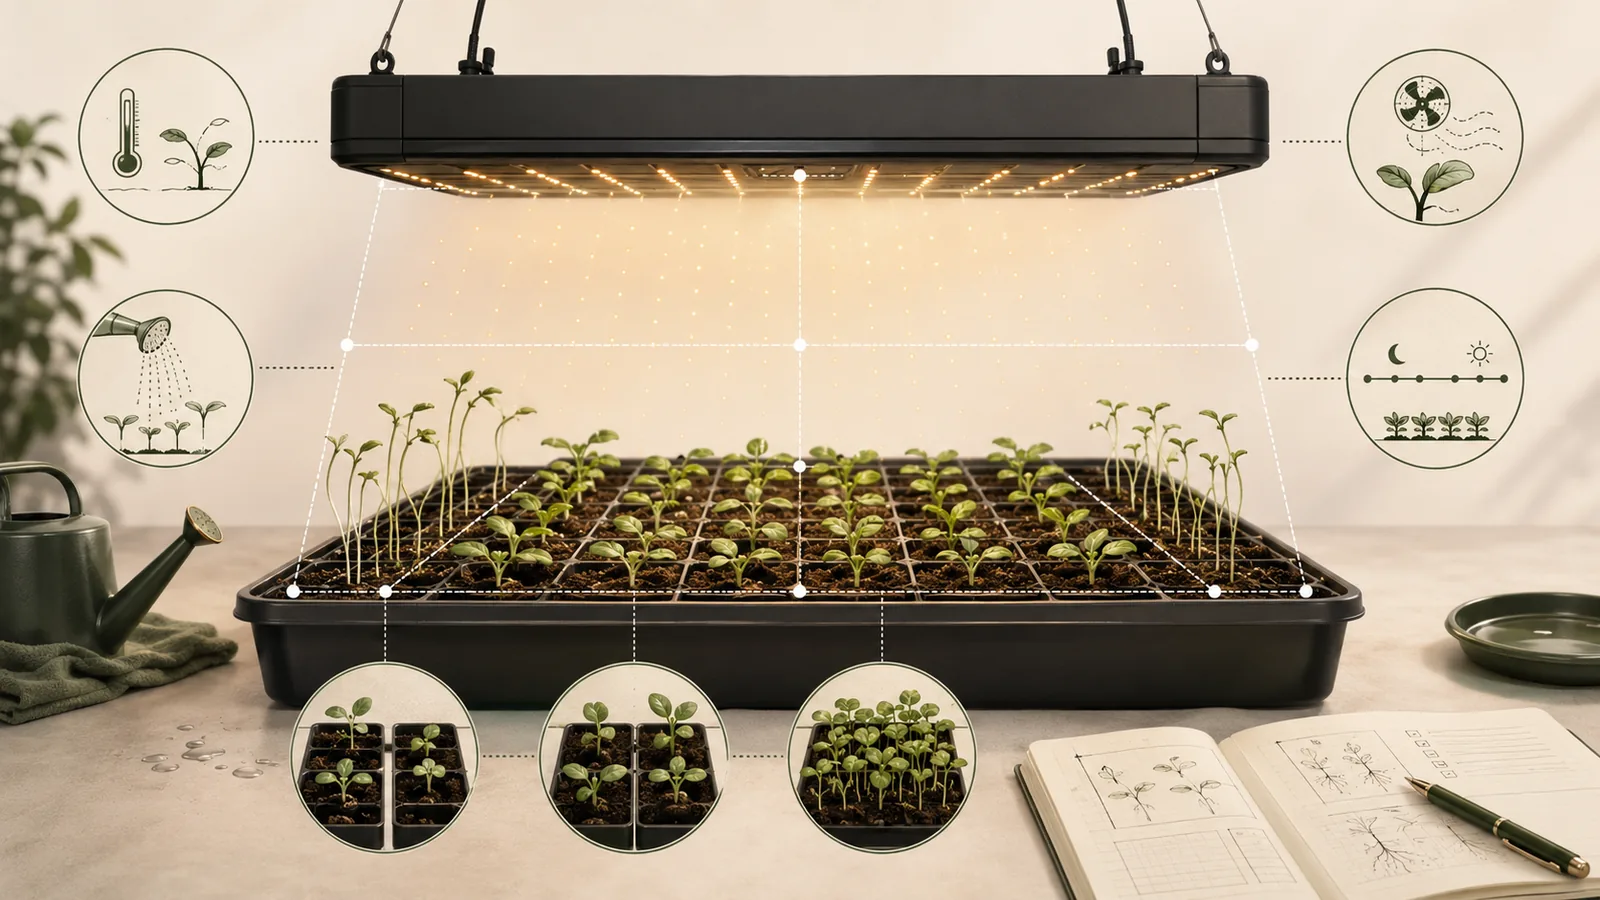
Evidence status: This is a source-based troubleshooting workflow for seedlings that appear tall, thin, weak, or tilted under indoor lights. Root & Photon did not grow, measure, diagnose, treat, or validate a seedling tray for this article. A symptom, center reading, technology label, fixture distance, or color description does not identify the cause by itself.
Quick answer
Leggy seedlings often need more useful light at the seedling plane, but “move the light closer” is not a complete diagnosis. Insufficient light is an important contributor; high temperature, excessive water, excessive fertilizer, crowding, late transplanting, crop differences, timer errors, uneven distribution, and disease-like collapse can produce or accompany weak growth.
Record the crop and stage, fixture and mode, plant-plane geometry, a representative PPFD grid or exact comparable map, actual light hours, temperature, spacing, water and fertilizer history, and when the symptom started. Use the pattern across the tray to choose the next check. Change one material variable at a time, remeasure the same points, and judge new growth. Stop rather than guess when the exact setup, source-qualified crop context, or plant-health evidence is missing.
Troubleshooting workflow summary
- Confirm that the seedlings are living and elongated rather than pinched, rotting, or collapsing at the media line.
- Map where the symptom occurs: whole tray, edges, center, one crop, one shelf, or every shelf.
- Verify the timer, actual photoperiod, fixture mode, dimming, height, area, and plant plane.
- Use an exact comparable PPFD map or a representative seedling-plane grid; do not rely on one center point.
- Review temperature, crowding, water, fertilizer, container timing, and natural-light changes.
- Choose the most supported branch and change one variable only.
- Repeat the same measurements and record new growth after the change.
- Escalate collapse, decay, rapid decline, or unresolved crop-specific questions to an appropriate extension or plant-health resource.
Decision factors
- Symptom pattern
- Whole tray, edge, center, one crop, one shelf, or every shelf. Pattern narrows the next check but does not diagnose the cause.
- Seedling identity
- Crop, cultivar when known, emergence date, current stage, container size, density, and transplant history.
- Received light
- PPFD at the current seedling plane across representative points—not fixture watts, lumens, a technology label, or one center value.
- Daily exposure
- Actual on-time and representative PPFD. When both are treated as constant, DLI is PPFD × hours × 0.0036.
- Temperature
- Actual air and, when relevant, root-zone conditions after emergence. Crop-specific sources remain controlling.
- Competition
- Spacing, neighboring leaves, tray density, and whether seedlings were left crowded or root-bound.
- Water and fertilizer
- Frequency, media condition, drainage, fertilizer product/timing, and whether the mix already contains nutrients.
- Plant-health boundary
- Pinched, water-soaked, rotting, collapsed, or rapidly declining stems require a different plant-health workflow.
Observable symptoms
Record what is visible before changing the setup. “Leggy” usually describes living seedlings with unusually long, thin stems, wide spacing between leaves, leaning toward a light source, or poor ability to hold themselves upright. The description is comparative: compare like crop, cultivar, age, and stage where possible.
| Observation | Possible branch to inspect | What it does not prove |
|---|---|---|
| Most seedlings are tall, thin, and leaning in one direction | Directional or insufficient light; tray position; obstruction; window contribution | That fixture height alone is the cause |
| Center seedlings differ strongly from edge seedlings | Distribution, overlap, boundaries, grid position, crowding | That the center reading represents the tray |
| Every tray under one timer stretches after a schedule change | Actual on-time, mode, dimming, outage, controller state | That the published timer schedule was executed |
| Only one crop or cultivar stretches | Crop habit, stage, density, emergence date, source applicability | That all crops need the same correction |
| Seedlings are soft or spindly in a warm, crowded, wet setup | Temperature, water, fertilizer, spacing, transplant timing as well as light | That more light is the only needed change |
| Stems are pinched, darkened, water-soaked, rotting, or collapsing at the media line | Plant-health or damping-off escalation | That this is simple light-related stretching |
Takeaway: Treat the observed pattern as a branch selector, not a diagnosis; compare it with the exact setup record before changing height, schedule, or another input.
Evidence to collect before changing anything
| Field | Record | Why it matters |
|---|---|---|
| Crop and stage | Species/cultivar, sowing and emergence dates, cotyledon/true-leaf stage | Normal architecture and applicable guidance differ. |
| Symptom map | Tray diagram or photos with scale; center, edge, one crop, all crops | Spatial patterns can point to distribution, crowding, or a shared environment. |
| Fixture configuration | Exact model, quantity, layout, mode, dimming, channels, and obstructions | Technology labels and watts do not define plant-plane light. |
| Plant plane | Distance to current seedling tops and the dimensions of the occupied area | Received light changes with geometry and growth. |
| Light evidence | Comparable map or representative PPFD points with locations and time | One reading cannot describe the tray. |
| Schedule | Programmed and observed on/off times, outages, mode changes, natural light | DLI depends on received light and actual duration. |
| Temperature | Air and relevant root-zone observations after emergence | Excess heat can contribute to spindly growth and interacts with light. |
| Spacing and container timing | Seedlings per cell, leaf overlap, root-bound signs, transplant dates | Crowding and delayed transplanting can contribute. |
| Water and fertilizer | Media condition, drainage, watering pattern, mix, product and timing | Excess water or fertilizer can contribute and disease can mimic weakness. |
| Change history | What changed immediately before the symptom appeared | Recent changes are stronger leads than generic assumptions. |
Takeaway: This record is the baseline for an interpretable check. Without the crop and stage, geometry, representative light evidence, actual hours, and recent-change history, a light-only correction remains unverified.
Step 1: Start with the tray pattern
Map the symptom before choosing a cause. If the entire tray changed after a timer, mode, room-temperature, or fixture-position change, inspect that shared input first. If the center and edges differ, inspect distribution and crowding. If only one crop differs, compare crop, cultivar, age, density, and source applicability before applying a whole-shelf correction.
Crowding can reduce available light and alter neighbor light cues. Plant-science reviews describe elongation as one possible architecture change under shade-avoidance cues, but the response varies among species and environments. This does not authorize a home spectrum recipe.
Step 2: Check received light at the seedling plane
Use the existing sizing and height records. Verify the exact fixture, mode, dimming, layout, area, height, boundaries, and current seedling plane. Use a manufacturer PPFD map only when its disclosed conditions match the setup. Attribute it as official specification evidence unless an independent method is documented.
When measuring, use the same point locations across the occupied tray. Retain the values rather than only the average. Report the minimum, maximum, average, and obvious center-to-edge pattern. A five-point sample is a useful screen but can still miss local bright or dark zones.
Do not substitute fixture watts, lumens, lux, Kelvin, “full spectrum,” a generic LED distance, or a hand-temperature check for representative plant-plane PPFD evidence.
Step 3: Check actual light hours and daily exposure
Confirm what the fixture actually did, not only what the timer was intended to do. Record on/off times, outages, manual overrides, dimming schedules, and changes in natural light. A spot PPFD reading can look adequate while actual daily exposure remains lower because the light ran fewer hours or in a different mode.
Constant representative PPFD:
DLI (mol/m²/day) = PPFD (µmol/m²/s) × hours × 0.0036
The calculation estimates daily photon exposure. It does not diagnose the seedling, select a crop target, or prove that changing photoperiod is the correct fix.
Keep the two-gate logic from the photoperiod workflow: arithmetic and biological schedule evidence are separate. Do not extend hours until the crop/stage source, dark-period treatment, and actual intensity support the change.
Step 4: Check non-light contributors
| Variable | Evidence to inspect | Boundary |
|---|---|---|
| Temperature | Actual conditions after emergence; heat mat status; crop-specific guidance | No universal post-germination temperature is approved. |
| Crowding | Plants per cell, overlap, edge shading, transplant timing | Thinning or transplant treatment remains crop- and stage-specific. |
| Water | Media saturation, drainage, dry-down pattern, root condition | This article does not diagnose or treat disease. |
| Fertilizer | Potting-mix contents, product, concentration, timing, label use | No dosing recommendation is provided. |
| Sowing/transplant timing | Age, true leaves, root-bound signs, time remaining before transplant | Regional calendars and crop timelines differ. |
| Crop or cultivar habit | Compare like plants at the same age and stage | No variety ranking or normal-height table is approved. |
| Plant health | Pinching, discoloration, water-soaked tissue, decay, collapse | Use an extension or plant-clinic workflow when disease signs are present. |
Takeaway: These variables can overlap, so compare the actual temperature, media, fertilizer, spacing, timing, and plant-health observations with crop-specific guidance before assigning a light-related cause.
Step 5: Choose the most supported differential branch
| Evidence pattern | Next controlled check | Do not conclude yet |
|---|---|---|
| PPFD is low across the tray and other conditions are stable | Use exact documentation or the height/sizing workflow to test one supported intensity or geometry change | That a universal distance or product is required |
| Center is high but edges are low | Inspect layout, area, overlap, boundaries, fixture orientation, and crop placement | That lowering the fixture will improve the whole tray |
| PPFD pattern is stable but actual hours are short | Verify timer/controller execution and apply the source-qualified photoperiod workflow | That a longer day is biologically suitable |
| Light evidence is reasonable but temperatures rose | Compare actual conditions with crop/stage extension guidance while holding light steady | That cooling alone will reverse existing elongation |
| Only crowded or overdue cells are spindly | Review spacing and transplant timing using crop-specific guidance | That every seedling needs the same handling |
| Media is saturated or stems are pinched/collapsing | Stop the light-only workflow and use a plant-health resource | That this is ordinary legginess |
| Evidence is missing or contradictory | Return `reconfigure_or_research` and collect the missing input | That symptoms authorize a guessed correction |
Takeaway: Choose the smallest check that matches the evidence pattern, keep other material inputs stable where practical, and do not treat the result as proof of a universal setting or diagnosis.
Worked grid example: why the center reading can mislead
The following values are invented for arithmetic QA. They are not measurements, crop targets, product specifications, or recommendations.
| Grid | Five PPFD points (µmol/m²/s) | Average | Minimum / average | Maximum / minimum | DLI |
|---|---|---|---|---|---|
| A | 90, 100, 95, 110, 240 | 127.0 | 0.7087 | 2.6667 | 6.4008 mol/m²/day |
| B | 160, 170, 165, 175, 210 | 176.0 | 0.9091 | 1.3125 | 8.8704 mol/m²/day |
Grid A: (90 + 100 + 95 + 110 + 240) ÷ 5 = 127.0 µmol/m²/s
Grid A DLI: 127.0 × 14 × 0.0036 = 6.4008 mol/m²/day
Grid B: (160 + 170 + 165 + 175 + 210) ÷ 5 = 176.0 µmol/m²/s
Grid B DLI: 176.0 × 14 × 0.0036 = 8.8704 mol/m²/day
Grid A has the higher center-like maximum, but the lower average and weaker edge pattern. Grid B is more even in this coarse sample. The example demonstrates only why center-only comparison is weak. It does not establish that either grid is suitable for a crop or that the seedlings will recover.
Corrective checks: change one variable and preserve the record
- Select the branch best supported by the collected evidence.
- State the one variable being changed and the reason.
- Keep other material inputs unchanged where practical.
- Record the before and after setup, time, grid, temperature, spacing, water, and fertilizer state.
- Repeat the same plant-plane measurements and tray photos.
- Evaluate new growth and the next leaves rather than claiming that old elongated stems have been reversed.
- Stop if the change creates conflicting symptoms, violates exact manufacturer instructions, or requires an unsupported crop/safety decision.
This is a troubleshooting record, not a controlled grow trial. It improves interpretability but does not create E3 validation or prove causation.
Failure conditions
- The crop, stage, emergence date, or tray density is unknown.
- The exact fixture, mode, dimming, height, layout, area, or hours are unknown.
- The only light evidence is watts, lumens, lux, a phone-app conversion, color label, or center point.
- The map conditions do not match the actual fixture, mode, height, area, grid, or boundaries.
- Height, dimming, hours, temperature, watering, fertilizer, and spacing are changed together.
- A source-specific numeric example is treated as a universal seedling prescription.
- A living elongated seedling is confused with stem collapse, decay, or damping-off.
- The proposed change depends on wiring, fixture modification, certification, pesticide, disease treatment, or another excluded safety/health decision.
- A product, retailer, price, affiliate link, outcome guarantee, or “best light” conclusion is introduced.
Stop and escalate
Stop the light-only workflow when seedlings are collapsing, pinched or decayed at the media line, rapidly declining, or showing a pattern that suggests disease or another plant-health problem. Use a local extension office, plant diagnostic clinic, or other qualified crop-specific resource. This article does not identify a pathogen or prescribe treatment.
Also stop when the correction requires a crop-specific PPFD/DLI target, an exact product decision, electrical or fire guidance, a spectrum recipe, or a claim that a seedling will recover. Those require separate evidence and, where applicable, specialist review.
Before you change the setup
- Have I described the symptom rather than named a diagnosis?
- Do I know the crop, stage, emergence date, density, and transplant history?
- Do I have representative plant-plane light evidence rather than one center value?
- Did I verify actual light hours and operating mode?
- Did I record temperature, water, fertilizer, crowding, and recent changes?
- Am I changing one variable and preserving a before/after record?
- Does the proposed change remain within exact manufacturer and crop-source limits?
- Will I judge new growth without promising recovery or yield?
- Do collapse, decay, or unresolved plant-health signs require extension help instead?
Methodology
Root & Photon reviewed current university-extension guidance on tall or spindly seedlings, indoor seedling care, light, temperature, water, fertilizer, spacing, transplant timing, and plant-health distinctions. The workflow also uses controlled PPFD/DLI terminology and map/grid logic from existing approved lighting packages, plus a current peer-reviewed review of shade-avoidance responses.
Every formula and illustrative grid was recalculated independently. Search-result patterns were used only to identify communication gaps. No product, seedling tray, PPFD map, timer, temperature, water, fertilizer, disease, recovery, or outcome was tested or measured by Root & Photon.
Sources
- Iowa State University Extension — The flower and vegetable plants that I started indoors getting tall and spindly. Why?
- University of Maryland Extension — Care of Vegetable Seedlings
- University of Minnesota Extension — Starting Seeds Indoors
- University of New Hampshire Extension — Starting Plants From Seed
- Penn State Extension — Seed and Seedling Biology
- Virginia Cooperative Extension — Calculating and Using Daily Light Integral (DLI): An Introductory Guide
- Iowa State University Extension — Important Considerations for Providing Supplemental Light to Indoor Plants
- University of New Hampshire Extension — Growing Seedlings Under Lights
- Plant Physiology — Avoiding the shadow: how plants perceive neighbors and reshape the crop light environment
- University of Maryland Extension — Starting Vegetable Seeds Indoors